Tolerance Analysis
Tolerances allow us to define how big or small a feature in a part can be so that it fits or fulfils its function. The greater or wider the tolerance, the cheaper and easier will be to manufacture. So as designers we need to define which is the maximum allowable tolerances and combinations of them.
In most common cases a feature interacts with several components, and in this cases we need to consider the whole chain of tolerances that will affect the function or part to fit.
Tolerance Stacks
This is the easiest and most straightforward method to calculate tolerances. It is used in 2D analysis and what we do is to sum the maximum and minimum tolerances and find out the worse scenarios.
This is a safe method, as it shows the worst ever possible conditions. But this implies that tolerances are usually tight.
Statistical tolerances
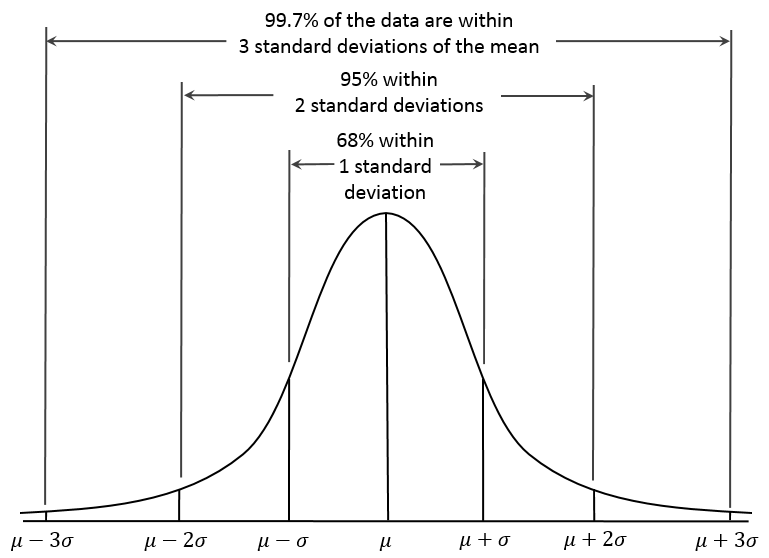
In this case we assume that there will be a distribution of all the tolerances (a bell curve) when manufacturing the parts. This means that most of the parts will be close to the mean or nominal dimension and only a few parts will be in the limit. If we look at the bell curve below, it shows that if we assume 3 standard deviations we will have 99.7% of the parts within tolerance, so only 0.3% of parts will be outside of tolerance, and statistically we would need all the features that contribute to the tolerance that we are analysing to be outside of this margin to be a non-conforming, or failure. Which if you think about it is unlikely to happen. So by using a statistical analysis we can relax the tolerances.
Examples
Here are two examples that I have created. The drawing shows simple blocks for illustration purposes.
Example 1
In this case we are interested in knowing the overall size when adding all the blocks together.
The dimensions and tolerance values are only for illustration purposes and the drawing is not to scale
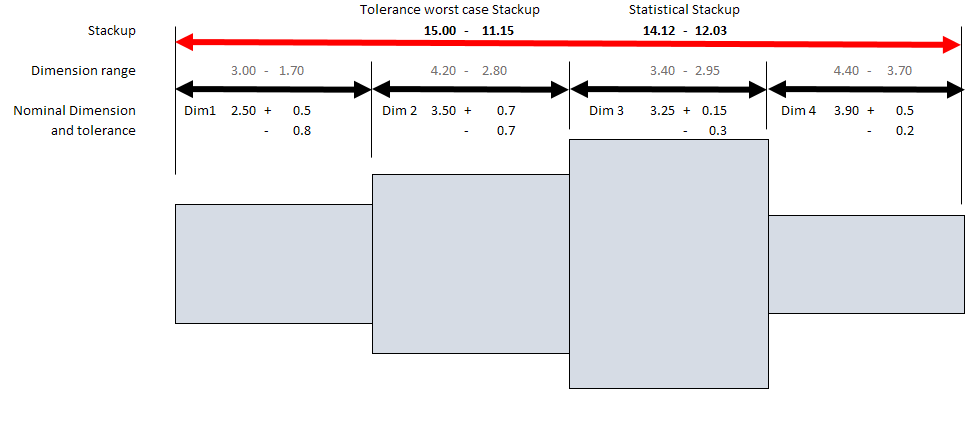
The information that we have to start is the value for each dimension (Dim 1 to 4) and their tolerances. What we do is first add the max values and the minimum values to see the normal “Stackup” or (worse case). In this examples it shows the the block will add 15.00 to 11.15.
The we calculate the “Statistical Stackup”. We start by finding the variation for each dimension, which is the MMC minus the LMC.
(for Dim1, 3.00 – 1.70 = 1.30)
MMC is Maximum Material Conditions , or how big the block can be. LMC is Least Material Condition, or how small the block can be. In other words, the upper and lower tolerance.
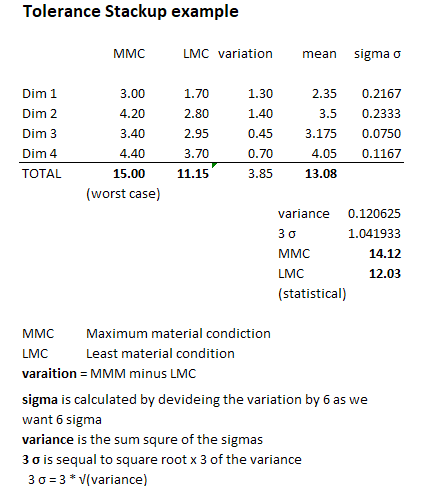
Then we find the the mean for each dimension, or the mid value.
(for Dim1 (3.00 + 1.70) / 2 = 2.35)
Here is where get interesting and confusing. We then calculate the sigma σ. We do this by dividing the variation by 6. We use 6 as we are assuming a 6 sigma distribution, we could use a more relaxed sigma, as 5 or 4. But the usual is to use 6.
(for Dim1 (1.30 / 6 = 0.2167)
Then we work out the variance, which us the sum square of the sigma values.
( 0.216² + 0.233² + 0.075² + 0.1167²) = 0.12062
We then calculate the 3 σ value. We do this by multiplying by 3 the square root of the variance. This will be the value that we will use to estime the statistical MMC and LMC.
(3 * √ 0.12062) = 1.0419
Now we add the 3 σ value to the mean of the total (13.08) to calculate the MMC. To calculate the LMC we subtract it
MMC = 13.08 + 1.0419 = 14.12
LMC = 13.08 – 1.0419 = 12.03
14.12 – 12.03 are the statistical values for the stackup. As we can see they show a smaller variance that the normal stack up. So what we can do now is to start to relax some of our tolerances if we can
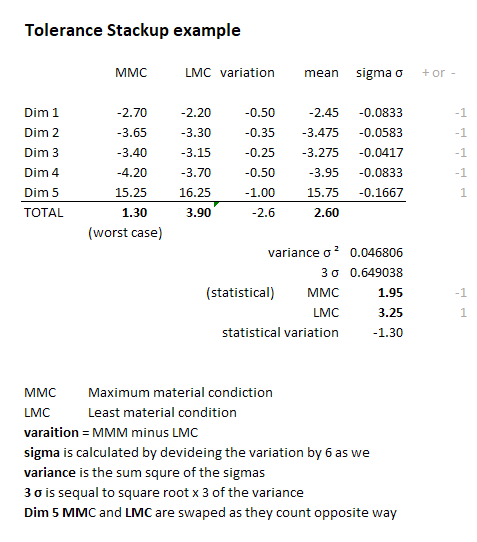
Example 2
This example works the same way, but in this case we use negative dimensions for some of the block as we are interested in a gap.
Hope it makes sense

Here is a link to the spreadsheet, feel free to use it.
I based my examples on the explanation provided here:
Statistical tolerances with real data
Once we start making parts we can gather real tolerance data and conduct further tolerance analysis.
Here is a link that describes a method to use:
https://accendoreliability.com/2015/01/09/root-sum-squared-tolerance-analysis-method/
This is a very detailed article about tolerance analysis. Worth reading if you want to learn more
“The purpose of this report is to describe various tolerance stacking methods without going into the theoretical details and derivations behind them. For those the reader is referred to Scholz (1995). For each method we present the assumptions and then give the tolerance stacking formulas. This will allow the user to make an informed choice among the manyavailable methods. The methods covered are: worst case or arithmetic tolerancing, simple statistical tolerancing or the RSS method, RSS methods with inflation factors which account for nonnormal distributions, tolerancing with mean shifts, where the latter are stacked arithmeticallyor statisticallyin different ways, depending on how one views the tradeoff between part to part variation and mean shifts.”
http://www.stat.washington.edu/fritz/Reports/isstech-95-030.pdf